EXCEL TECHNIQUES
DIGITIZING DATA using CHARTS and SCREENSHOTS – Step 3
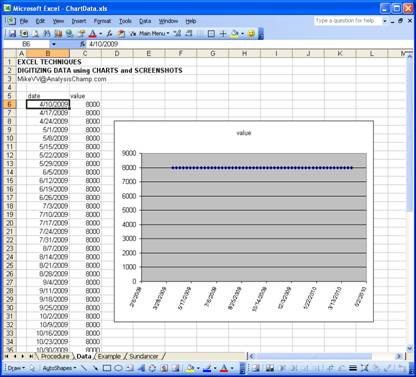
3. Create initial Excel data table and scatter plot with initial values as follows:
Procedure Steps:3.1 Add a two-column range of data and insert a scatter chart with INSERT > CHART > SCATTER |
|
Procedure Steps:
3.2 ... And format the chart to fit on the worksheet. |
|
Reference Microsoft Excel Help for detailed instructions for each step.